Quarkside

12/06/2012

7DIG: Identity Trust Matrix

Filed under: Innovation,Risk,Security — lenand @ 2:49 pm
Tags: ,

Here is a suggestion for a visual chart that will help people to understand risk they are taking in electronic transaction between a customers and suppliers of goods or services.  How much should a supplier trust a potential customer? – and vice versa?

Trust Matrix

 Identity Trust Matrix

Suppliers look at the vertical axis and decide how much value is at risk if the customer avoids paying for what is delivered – whether by deliberate fraud or by accident.  In other words, what level of trust can be placed in customers’ electronic credentials?

Customers look the horizontal axis to gauge whether the Trust Level of a credential is sufficient to meet the value of potential purchases.

Each transaction is given a Trust Index with a calculated value from 0 to 100.  These are split into three ranges of high, medium and low risk – from a supplier’s perspective.

  • RAG         Risk                 Trust Index  Proceed?
  • Red          High Risk           10-100       Unwise to proceed
  • Amber      Medium Risk      2.5-10        Proceed with caution
  • Green       Low Risk              <2.5         Sufficient eID to proceed

The amber area of the matrix is where the reputation of each party should be considered in addition to the trust level.  What is the trading history of both customer and supplier? Ebay traders understand this principle.

Clearly, the matrix depends on the agreement of Trust Levels of credentials.  Quarkside has not developed a firm proposal, but here are some starting suggestions for four ranges (with maximum low risk value):

  • 1         (£10)         Username and password.
  • 2,3      (£100)       Additional personal secrets;
  • 4-6      (£1000)     Documentary evidence of identity, such as banks’ “Know Your Customer” requirements.  Inclusion of credit agency data.  Face to face interviews by the enrolment agency may be needed. Sufficient to obtain a passport;
  • 7-10     (£10,000)  Biometrics necessary to complete transactions.  The highest levels would have government security vetting and very strong protection against counterfeit credentials.

If this sparks any interest, suggestions to help definition of trust levels will be considered.  The background to the need for an Identity Trust Matrix will be the subject of future posts, following the 7DIG framework.

14/02/2012

Right to be forgotten: Is it practical?

Filed under: Governance,Politics,Privacy,Process,Risk — lenand @ 8:08 am
Tags: , ,

The reform of the EU’s data protection framework has an explicit requirement that obliges online social networking services (and all other data controllers) to minimise the volume of users’ personal data that they collect and process.  Furthermore, data controllers must delete an individual’s personal data on request – assuming there is no other legitimate reason to retain it.

One wonders if this also applies to back-up and archive files.  The best organisations may be able to trawl through history, selectively remove personal records and produce an audit trail to prove it.  It may start messing up statistical reports – but that a minor problem when most public sector organisations do not have information governance processes capable of tracing individuals – let alone removing all traces of them.

12/02/2012

7DIG: Time needs more than philosophy

Filed under: Assets,Governance,Objectives,Outcomes,People,Process,Risk,Time — lenand @ 10:08 am
Tags: , ,

The Time component of the seven dimensional information governance (7DIG) framework was of little practical interest.  The spatio-temporal paradigm may hold the philosophical high ground, but a treatise on Gantt charts would have been out of place.  Serendipity has revealed a practical product, which is free, and is based on a philosophy of teams doing the right thing at the right time.  It brings together the People who have to do the information governance with the Process that sets Objectives and uses Assets to achieve the desired Outcomes.  And it has a Risk register.

It is project based – ideal for setting up an Information Governance process and should be adaptable for continuous monitoring. Look at some of the features:

  1. People from any department or supplier
  2. Assets, such as an information asset register and documentation, as a sharable resources
  3. Objectives, as part of the textual description including a breakdown into areas of interest or phases of work
  4. Process description in the form of tasks, which can be repeatable, taking us through the identification to deletion cycle
  5. Outcomes by the way of documented completion of tasks and compliance with targets
  6. Time charts, calendars, milestones and the possibility to export to your favourite Gantt chart tools
  7. Risk register, very simple to input and understand but good enough in most Information Governance régimes

The openness is especially encouraging.  It is completely Web-based and viewable from your iPod, iPhone or iPad.  Even the name is encouraging – Teamwork.

Quarkside wondered why such a simple product has not popped up in the radar previously.  Maybe it has only been promoted within the systems development community – and not yet reached public sector ICT managers.  Another job for Socitm?

01/12/2011

IG Time: the spatio-temporal paradigm

Filed under: Time — lenand @ 11:34 am
Tags: , ,

Time is one dimension of the spatio-temporal paradigm – which has an underlying principle:

All Things exist in a universe of four dimensions, three of space and one of time.  

And a significant consequence:

All Things in the past and future can be defined, in addition to all Things in the present.

Adopting the 4D paradigm is useful in information management:

  • The state of a Thing can be defined by the time between a start event and an end event.
  • Things can have many states at any point in time.
  • Relationships can be defined between any Things, and such relationships also have time dimensions.

These can be applied in the domain of the 7 Dimensional Information Governance framework (7DIG).  The seventh dimension considered, Time, is thus more than a clock and more than planning.  Time is one dimension of the Space-Time continuum; three dimensions of space and one of time.  7DIG framework is a model of concepts and the relationships between those concepts.  It is an ‘ontology’.  The Framework has attempted to develop a shared vocabulary and definition of concepts.  Unfortunately these concepts have been called dimensions and sub-dimensions.  In retrospect, another set of words may have been better to avoid possible confusion.

The 7DIG Time dimension applies to all the other six dimensions of the 7DIG framework ie Objectives, Assets, People, Outcomes, Process and Risk.  Every single sub-dimension can have the question asked ‘When?’.

Many thanks to Matthew West for providing the academic background. Expect more postings on some practical aspects of Time in relation to information governance

14/11/2011

A Framework for Frameworks

Filed under: Innovation,Outcomes,Politics,Process,Risk,Strategy,Time — lenand @ 4:24 pm
Tags: , ,

Whilst reviewing a worthy document on leadership in ICT, it seemed to lack structure.  The contents were fine, but left an uneasy feeling that not everything had been covered.  Was the advice MECE?  This led to a Leadership Model, reminiscent of one used by Quarkside before (7DIG).  The seven primary dimensions were Direction, Stakeholders, Resources, Action, Outcomes, Time and Risk.

The Expanded Leadership Model is probably a reasonable Framework for many ICT organisations.

It triggered an idea of a Framework for Frameworks. A self-help tool that gives a structure for all MECE dimensions.  It starts with seven generic concepts.

  1. Context:  the business environment and constraints
  2. Subjects:  People who are involved in processes
  3. Verbs: Words that denote action by people, Process
  4. Objects:  Things that are resources to be consumed or created
  5. Outcomes: Desired results from the process actions
  6. Time:  When things are to be done
  7. Risk:  What can disrupt the Process – and how to manage risk

The diagram may help some people.  Let us know if it has helped you.

Let the organisation decide the next level down.  They know the trigger points and politics that will enable changed behaviour or transformation of processes.  For many purposes, this simple framework for frameworks should be more effective than McKinsey’s famous 7S framework for changing organisations.

20/10/2011

7DIG: Ranking Risk

Filed under: Governance,Risk — lenand @ 9:09 am
Tags: , , , ,

The third and final part of the Quarkside risk method solves the problem of ranking, or prioritising, risk across any selected domain, large or small.   Other risk ranking methods eg a Risk Matrix, are too subjective and can miss  important  risks.

Crilog Risk Index

The Crilog Risk Index (CRI) evaluates risks consistently across whole organisations.  In a scale ranging between 0 and 100, it gives a single value for any risk impact between £1000 and £10 billion.  The absolute value is not significant; it is to allow ranking and setting priorities for risk reduction action plans.  A CRI value is calculated for every entry in a risk log.  It is a logarithmic function of the probability and impact of the risk.  Impact assessments only need to be “order of magnitude”.  The number of zeroes is all that really matters  and people are comfortable in saying that a risk is somewhere between £100k and £1million, for example.

After calculating the CRI, risk can be assessed according to which band it occurs and given a “Traffic Light” colour.   The ranges are arbitrary and can be modified to suit the risk appetite an organisation.

Colour Description Action CRI
Red Potential disaster Act now – advise directors 64 to 100
Yellow High risk Manage down 32 to 64
Green Manageable risk Monitor monthly 0 to 32

The major benefit of using this single value index is that it can be used on completely independent risks logs, whether they cover corporate, departmental or project risks.  At any time it is possible to merge risk logs and present a consolidated view of importance.

Crilog Risk Cube

Quarkside recommends adding an additional dimension to the traditional 2-dimensional risk matrix – to make a Risk Cube.

The Probability axis is linear from 0% to 100% and the Impact axis is a logarithmic scale that easily show £billions or even £trillions alongside £thousands.  The third axis is the Risk Index, which is coloured by traffic lights and a size proportional to the value.

Compared to the traditional matrix, the Cube graphically draws attention to important outliers, such as:

  • Risks that are almost certain to impact the bottom-line performance of a company; very high probability of loss
  • Risks that could potentially destroy a company; very low probability but very high impact.

Although it requires a culture change for people to allocate values to both the impact and probability of entries in the risk log, in practice it works well.  It produces clear method for ranking any magnitude of risk across different divisions or programmes.   It fits well with confidence measurement, in a non-threatening environment, as a small step towards using percentages for risk probabilities and orders of magnitude for risk impacts.

Monthly monitoring of changes to a Risk Index, at least for the high  values, show the health of projects and programmes.  It would be a miniscule proportional of  total expenditure for the benefits achievable.  Organisational leadership must now ensure that action takes place to remove, mitigate or minimise risk.

19/10/2011

7DIG: Identify Risk with Confidence

Filed under: Governance,Risk — lenand @ 10:35 am
Tags: , , , , , ,

Using Confidence to Identify Risks

Rather than starting the search for risks in a negative way, Quarkside recommends using the reverse psychology to ask about success – “How confident are you that targets will be met?” Asking about confidence levels not only helps to identify risks, it shows a positive view rather than a negative one.  Simple bar charts can be used to show targets, changes of opinion and alerts for areas of concern felt by staff.

Average Confidence

The chart above may look gloomy, but this was the state of play in a large public sector project. It was the result of interviewing many levels of staff.

  • Anything below 50% confidence is worth further investigation and should be entered in the risk log.  Immediate risk reduction action should be taken.
  •  For intermediate levels of confidence, say between 50% and 75%, risk log entries should reflect the reduced level of risk.  The root cause for reduced confidence should be investigated.
  • Even if there is high confidence of success, greater than 75%, then there should be a risk log entry if the impact of failure is high.

Without claiming intellectual rigour,

Risk Probability% = 100% – Confidence%

Managers are comfortable with this concept – high confidence equates to low risk and vice versa.  Discussion helps people to accept that simple quantification of risks is neither difficult nor threatening.

Confidence Management Process

Confidence Management Process

It may be old-fashioned, but Quarkside is a proponent of managing to a baseline, or vision or goal or whatever you want to call it.  Lets also call them strategic objectives.  The main point is that they are organisation wide, and that leadership has ensured that everybody understands and has bought into them.

Interviews are carried out using a one-page questionnaire that records levels of confidence.  A five-point scale ranges from totally confident to minimally confident.  Subsequently, values from 90% to 10% are allocated.  The analyst can also select extreme values, say 100% or 0%, if the interviewee stresses strong opinions during the course of an interview.  Comments on the reasons for low values are welcomed – highlighting the root cause of a risk if raised by several interviewees.

To encourage open and frank responses, an independent interviewer asks questions in confidence and ensures that comments are not attributable to a specific person.  Interview data is analysed and presented in a report.  The contents include commentary on areas of high and low confidence and references to the risk log.

After several months second and subsequent reports discuss the change in confidence levels since the previous report.  A change chart graphically indicates the effect of risk reduction since the previous review.  The process provides feedback into the risk management control loop.

Most importantly it supports the risk management process by flushing out risks that may not have been formalised.  In extreme circumstances, it could contribute to a decision to change the baseline business or project targets.

Experience

The method has shown benefits in £billion programmes – but it could be applied in any form of project – even Agile ones.    Some key findings were:

    • Confidential, non-attributable interviews help to open up discussions and identify root causes of problems.  It allows comment at peer level that might not surface in the presence of overbearing managers
    •   The initial interview requires a few minutes to explain the concepts and establish understanding of the business objectives.  Subsequent interviews are quicker to execute and frank answers are obtained in less than one hour.
    •  The questioning technique encourages managers to think more quantitatively about business targets and the probability of achieving them.  They feel comfortable that 90% confidence has a residual 10% risk, and that it is fair to include it in a risk log.
    • Levels of confidence can diverge extremely between interviewees.  Whether lack of communication or “head in sand”, it is useful data worthy of further investigation.
    • In programmes experiencing difficulties, the results provide a focus for debate at board level.  One organisation used the results to renegotiate a major contract.
    • Even with generally satisfactory levels of confidence, it is worth investigating the target with the lowest confidence.  One internal audit team raised a security risk with an impact greater than £1 billion; procedures were tightened.  This is the company-threatening risk that is missed by using traditional risk matrices and resulted in the Risk Index to be described in the final section.

Looking to the future, the method should be used on all public sector programmes that rely on computer information for success eg Universal Credit, Health Service ICT, Individual Electoral Registration,  the Government ICT Strategy and Identity Management.


18/10/2011

7DIG Risk Revisited: The Problem of Risk Matrices

Filed under: Innovation,Risk — lenand @ 10:09 pm
Tags: , ,

Several years ago, project risk was high up the agenda especially in PRINCE2 projects.  But it was always viewed negatively.  People are naturally reticent about exposing risk in their area of responsibility.  Much more positive responses were achieved by reversing the questions and asking for levels of confidence.  Let’s call it Confidence Management, rather than Risk Management.  There are examples of success.

The method starts with interviews for assessing levels of confidence in achieving business targets.  Confidence levels are used to generate data in risk logs, which quantify business risk as a company wide, or even global, risk index.  It has a simple value for risk impacts that range from a few pounds to billions.

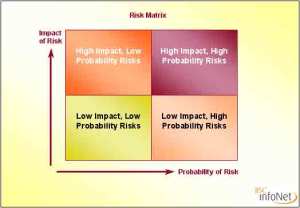
A 2X2 risk matrix is commonly used.

Risk2X2

2X2 Risk Matrix

It does not give much information, but better than nothing.  More complicated versions with colour coding can alert senior executives.

5X5 Risk Matrix

The main problem of such matrices is that they mask the importance of very low probability, but very high or catastrophic risk impacts.  The undersea blow-out of a BP oil rig is a recent example. Some risk impacts have to be measured in billions, but such crude methods do not alert people adequately. The axes are often not given numerical values and therefore impossible to correlate projects across a programme.

The next blogs show a new way of identifying risks and a quantitative method for prioritising risks across complex programmes.

28/07/2011

Recipe for Rip-Offs – Quarkside Dunnit

Filed under: Governance,Outcomes,Policy,Politics — lenand @ 7:46 am
Tags: , , ,

How encouraging that Quarkside produced the strapline for the PASC Report Government and IT — “a recipe for rip-offs”: time for a new approach.  The author was quoted in paragraph 102.   It was taken from a longer statement  made in January.

“Complete outsourcing is a recipe for rip-offs. “

It even made the morning BBC news bulletins.  More importantly, it has been open and frank with criticisms and  recommendations.  There is little to cause negative comment from Quarkside.  Just read the full report.

The only area for improvement would be to link the concept of outcome based commissioning in paragraph 75:

“The Government must stop departments specifying IT solutions and ensure they specify what outcomes they wish to achieve, within the broad technical parameters to ensure interoperability.

with the discussion on Waterfall versus Agile Development.

The model in paragraph 81 does not mention outcomes.  Outcomes are the starting point of Quarkside’s Seven Dimensions of Information Governance (7DIG).  This is a nice example of using 7DIG to test validity of governance plans.  Agile is also seen as experimentation.  That’s fine, but the scientific method creates research goals.  These goals can be set at each iteration and possible future goals reviewed – and the outcomes must be re-visited.

02/03/2011

IG Process: Due Diligence

Filed under: Assets,Objectives,Outcomes,People,Process — lenand @ 9:50 am
Tags: , ,

“Information Governance is the setting of objectives to achieve valuable outcomes by people using information assets in a process that considers both risk and time constraints.”

Information Governance (IG) must have Process. The Process must consider IG Objectives, Outcomes, People and Assets.  Theses are the critical first five dimensions of the Seven Dimensional IG ramework (7DIG).

Again, we can use the magic number seven to subdivide the Process dimension. Seven transitive verbs, Acquire, Validate, Store, Protect, Update, Publish and Dispose cover most governance operations. It is a continuous life cycle, capable of being monitored and controlled at every stage:

  • Acquire: Data acquisition, in the 7DIG Framework, includes action around analysis of the information assets and data modelling. The context of data collection is vital to onward processing and re-use in further processes. Quarkside subscribes to the concept of Master Data, Operational Data and Derived data. Master data is relatively static reference data. All data has to be acquired and subjected to further governance processes.
  • Validate: Incorrect data causes inefficiency, often accounting for 80% of administrative effort on systems; but far worse is the impact of poor information on decision making and information sharing. Good governance requires metadata and the use of standards to be embedded in the culture. Validation implies comparison of input data with a standard that is enshrined in metadata. Even paper-based publications are subject to validation against standards of grammar and probity before they are published.
  • Store: Imagine data stores as silos. Individual grains of data are added until required for further processing. Vast volumes of operational data are stored for subsequent processing. Documents are added to filing cabinets or archive shelves. In the best regulated environments there are custodians who know where the data is and how to retrieve it.
  • Protect: Data protection and security of access is an industry in itself. It makes sense to protect any valuable asset and information is no exception. Identity management, likewise, is an all pervading topic. It has to cover the identity of the data subject and the identity of the data investigator. For information sharing between agencies, accurate data matching depends on the quality of subject identities.
  • Update: Over the course of time, there are changes to facts and figures. Records need to be retrieved and modified. There are elements of feedback to make corrections as a result of performance monitoring and analytical processing. Derived data can be added to the data stores.
  • Publish: Data should be published only to those who are entitled to use it or see it. This could even be open data provided to the general public, such as the £500 contracts with local government.
  • Dispose: Oft forgot is the need to delete data. The DPA requires that data should be held only as long as necessary. Whereas this is probably true of major corporate systems, this governance step may not always extend to private document files, emails and spreadsheets. Many operational documents can be safely shredded in less than ten years; others, such as children in care records, have a statutory limit of 125 years. The key to a good disposal policy is the Information Asset Register, wherein the metadata should include the disposal policy. Transfer to the National Archive should also feature as a category when documents may have historical importance when not required by a local authority or other public body.

Governance matters, but it cannot be a universal set of rules. Neither do frameworks guarantee good governance. Frameworks can only provide simple diagrams and checklists, they cannot provide the thinking or knowledge needed in any specific context.

So why bother promoting a framework? The justification is that that requirements are so diverse that a team is needed to cover all aspects at sufficient depth. People need at least an overview of some specialist issue. Hence the importance of a MECE approach that does not drill into the detail, but tries to cover all important topics (aka dimensions).

Next Page »

Create a free website or blog at WordPress.com.